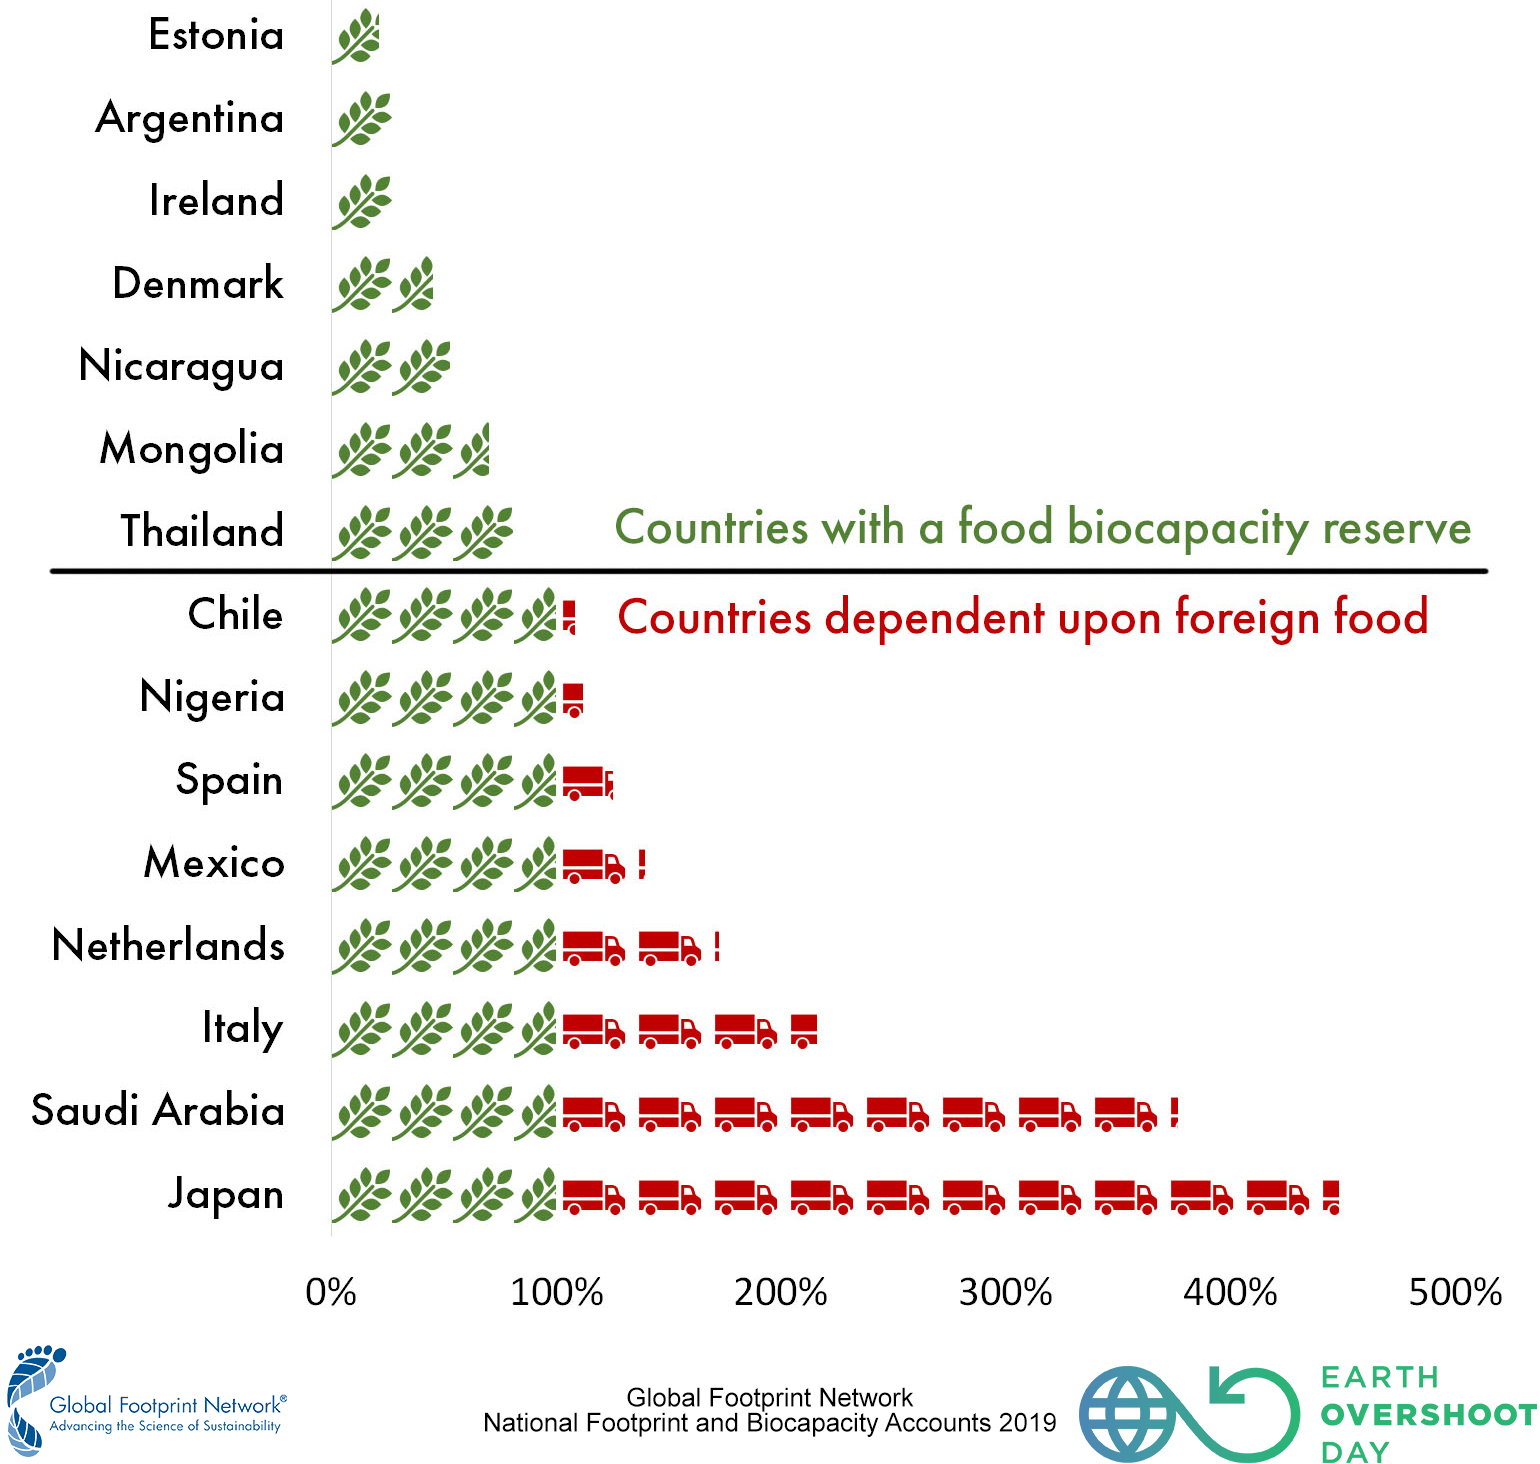
The chart above shows countries experiencing food deficits or reserves. Green plants represent food demand which can be met by the country’s food biocapacity (cropland, grazing land, and fishing grounds), while red trucks represent food which must be imported to satisfy the needs of the population.
Beef from Brazil. Coffee from Colombia. Olive oil from Italy. Rice from Thailand. Chances are your meals today included ingredients from abroad. Buying and selling agricultural commodities has become an unremarkable part of global trade and for many countries it has become a necessity. Why? Because the distribution of agriculturally productive land no longer aligns with where people live. Humanity’s Ecological Footprint associated with food adds up to nearly half of the planet’s biocapacity. This demand for food competes with all other demands: housing, mobility, goods and services, all of which are increasing.
The ups and downs of a globalized food supply chain
Although a more globalized food system can result in lower food prices and act as a buffer against local shocks to food production, it also means that many more countries are able to exist in a ‘food deficit’. This means that residents of those countries are consuming more food than their country’s agricultural areas can provide, making them more vulnerable to global food shocks.
The COVID-19 pandemic has shed light on our food system’s risks and fragilities across the globe. Several countries in West Africa, such as Ghana and Ivory Coast, lost income from decreased international demand for specialized crops such as cocoa. This threatens the ability of millions of farmers to secure a living wage. For instance, sub-Saharan Africa relies heavily on imported grains, whose prices briefly soared as a result of export restrictions implemented during the pandemic by major producers such as Russia and Vietnam. Shocks such as these are particularly challenging for lower-income countries under stress, like Ethiopia, Uganda and Kenya, which have been plagued by locust swarms in 2020.
For high-income countries, foreign food dependence, or imports from other countries, is typically not an immediate risk. For example, despite needing to import over 90% of its food from abroad, Singapore has enough purchasing power to outbid others on the global market. Food insecurity is a real and growing issue for many, even in countries with higher average incomes. In those situations, it is the direct result of economic inequality, rather than the inability to supplement local food production with foreign imports.
Nevertheless, the countries who are most vulnerable to food insecurity and disruptions are those who face the risk of food deficits compounded by incomes too low to compensate the deficit. They do not have the purchasing power to compete with others for the extra food in international markets.
Anticipating disruption
Disruptions to the food system are set to become more common, whether caused by abrupt changes in weather patterns, financial turmoil, health crises, or freshwater shortages. This will put even more pressure on farmers to adapt to a changing climate and new resource constraints. Higher demand caused by rising populations and increasing incomes, coupled with growing urban-rural inequities, will add to the strain.
To shed light on the risks caused by food deficits and low incomes, Global Footprint Network quantified these factors. The Ecological Footprint-based, environmentally-extended Multi-Regional Input-Output assessments (EE-MRIO) make it possible to allocate portions of the Ecological Footprint to various consumption activities, including food consumption. This allows us to compare the Ecological Footprint of each country’s food consumption with their own ecosystem’s capacity to produce food. The overall patterns are clear: major agricultural producers such as Ukraine, Argentina, and the United States consume less than they are capable of producing. In contrast, countries with high incomes and little biocapacity per person such as Switzerland, Belgium, Saudi Arabia, and Japan run significant food deficits.
As mentioned before, high-income countries aren’t the only ones with a high level of dependency on foreign food: some low-income countries, including Haiti, Afghanistan, and the Gambia, consume far more than their croplands, grazing lands, and fishing grounds can produce. In a world that is ecologically overstretched, these countries are the ones most exposed to global food shocks.
Future food security
An important outcome of our analysis is the understanding that countries which may appear to exhibit high levels of agricultural productivity are not actually able to feed themselves. This can be at odds with popular narratives, such as in the case of The Netherlands. In a 2017 feature story, National Geographic claimed that “This Tiny Country Feeds the World.” They even asserted that, “The Netherlands has become an agricultural giant by showing what the future of farming could look like.”
However, our MRIO data shows the opposite. Although the Netherlands boasts high-tech greenhouses and billions of dollars in exports, they remain highly dependent on foreign imports when the entirety of their national food consumption patterns are taken into account. Food consumption by Dutch residents exceeds their food biocapacity by 70 percent in net terms. A better lens through which to view countries or regions such as the Netherlands is that of an ‘agricultural assembler.’ The country imports feed, energy, and resources to “assemble” specialized, high-value goods such as livestock and vegetables rather than produces food with materials sourced from within the country’s border. This stands in contrast to the basic food commodities which are most important to global diets, such as grains and cereals. Dutch agricultural exports may look impressive on financial books, but they represent biocapacity borrowed from far beyond their own borders.
As climate change imposes new constraints on all of us, many are beginning to think about how they can better guarantee their own food security. This is a promising development, but only if it is achieved via regenerative farming techniques that leave the soil, water tables, and biodiversity intact. Also, like any other sector, they need to wean themselves from fossil fuel use. Currently, policy mainly directs more resources into the national agricultural sector without necessarily helping its transition to being regenerative. The transition will also require a more balanced diet with fewer animal products. This will not only be kinder to the planet, but also healthier for you!
BACK TO FOSSIL FUEL PAGE
Foreign Food Dependence
Click table header to sort
| Country | Food Ecological Footprint | Food Biocapacity | Food EF/Food BC |
|---|---|---|---|
| Afghanistan | 0.48 | 0.37 | 1.29 |
| Albania | 0.94 | 0.68 | 1.37 |
| Algeria | 0.75 | 0.47 | 1.59 |
| Angola | 0.54 | 1.45 | 0.37 |
| Argentina | 1.65 | 6.14 | 0.27 |
| Armenia | 1.00 | 0.64 | 1.56 |
| Australia | 0.87 | 10.30 | 0.08 |
| Austria | 1.02 | 0.81 | 1.27 |
| Azerbaijan | 0.92 | 0.60 | 1.53 |
| Bahamas | 0.99 | 8.03 | 0.12 |
| Bahrain | 1.10 | 0.44 | 2.5 |
| Bangladesh | 0.49 | 0.32 | 1.50 |
| Barbados | 1.18 | 0.10 | 11 |
| Belarus | 1.49 | 1.31 | 1.14 |
| Belgium | 1.33 | 0.37 | 3.6 |
| Belize | 2.41 | 1.70 | 1.42 |
| Benin | 0.85 | 0.56 | 1.53 |
| Bhutan | 0.97 | 0.64 | 1.52 |
| Bolivia | 2.08 | 2.86 | 0.73 |
| Bosnia and Herzegovina | 1.26 | 0.66 | 1.9 |
| Botswana | 0.82 | 2.55 | 0.32 |
| Brazil | 1.40 | 2.23 | 0.63 |
| Brunei Darussalam | 0.24 | 1.26 | 0.19 |
| Bulgaria | 0.88 | 1.89 | 0.46 |
| Burkina Faso | 0.77 | 0.71 | 1.08 |
| Burundi | 0.32 | 0.33 | 0.98 |
| Cameroon | 0.87 | 0.82 | 1.05 |
| Canada | 1.33 | 6.43 | 0.21 |
| Central African Republic | 0.84 | 0.87 | 0.97 |
| Chad | 1.12 | 1.50 | 0.74 |
| Chile | 1.27 | 1.17 | 1.08 |
| China | 0.99 | 0.62 | 1.58 |
| Colombia | 0.87 | 1.52 | 0.57 |
| Congo | 0.51 | 3.06 | 0.17 |
| Congo, Democratic Republic of | 0.19 | 0.42 | 0.46 |
| Costa Rica | 0.91 | 0.81 | 1.12 |
| Côte d'Ivoire | 0.60 | 1.39 | 0.43 |
| Croatia | 1.21 | 1.54 | 0.78 |
| Cuba | 0.67 | 0.54 | 1.24 |
| Czech Republic | 1.08 | 1.11 | 0.97 |
| Denmark | 1.65 | 3.64 | 0.45 |
| Dominican Republic | 0.67 | 0.40 | 1.69 |
| El Salvador | 0.82 | 0.51 | 1.60 |
| Equatorial Guinea | 0.53 | 0.79 | 0.67 |
| Eritrea | 0.33 | 1.48 | 0.22 |
| Estonia | 1.16 | 5.46 | 0.21 |
| Eswatini | 0.77 | 0.73 | 1.05 |
| Ethiopia | 0.54 | 0.49 | 1.10 |
| Fiji | 1.25 | 1.03 | 1.21 |
| Finland | 1.09 | 3.11 | 0.35 |
| France | 1.07 | 1.29 | 0.83 |
| French Guiana | 0.57 | 14.51 | 0.04 |
| Gabon | 0.91 | 5.69 | 0.16 |
| Gambia | 0.59 | 0.53 | 1.12 |
| Georgia | 0.84 | 0.61 | 1.37 |
| Germany | 0.91 | 0.81 | 1.13 |
| Ghana | 1.00 | 0.98 | 1.02 |
| Greece | 1.43 | 1.26 | 1.14 |
| Guadeloupe | 0.56 | 0.33 | 1.7 |
| Guatemala | 0.82 | 0.64 | 1.28 |
| Guinea | 0.97 | 1.37 | 0.71 |
| Guinea-Bissau | 0.74 | 2.51 | 0.30 |
| Guyana | 1.21 | 7.72 | 0.16 |
| Haiti | 0.34 | 0.28 | 1.22 |
| Hungary | 0.73 | 1.60 | 0.45 |
| India | 0.45 | 0.36 | 1.24 |
| Indonesia | 0.75 | 0.94 | 0.80 |
| Iran, Islamic Republic of | 1.01 | 0.60 | 1.69 |
| Iraq | 0.51 | 0.14 | 3.6 |
| Ireland | 0.75 | 2.78 | 0.27 |
| Israel | 1.15 | 0.16 | 7.0 |
| Italy | 1.19 | 0.55 | 2.2 |
| Jamaica | 0.53 | 0.27 | 1.9 |
| Japan | 0.83 | 0.18 | 4.5 |
| Jordan | 0.72 | 0.08 | 8.6 |
| Kazakhstan | 1.49 | 3.33 | 0.45 |
| Kenya | 0.54 | 0.43 | 1.26 |
| Korea, Democratic People's Republic of | 0.27 | 0.33 | 0.81 |
| Korea, Republic of | 1.15 | 0.52 | 2.2 |
| Kuwait | 1.27 | 0.34 | 3.8 |
| Kyrgyzstan | 0.62 | 1.03 | 0.60 |
| Lao People's Democratic Republic | 1.25 | 1.00 | 1.25 |
| Latvia | 1.58 | 4.22 | 0.37 |
| Lebanon | 1.20 | 0.18 | 6.7 |
| Lesotho | 0.58 | 0.73 | 0.80 |
| Liberia | 0.34 | 1.02 | 0.33 |
| Libyan Arab Jamahiriya | 1.01 | 0.63 | 1.61 |
| Lithuania | 1.94 | 2.94 | 0.66 |
| Luxembourg | 1.45 | 0.36 | 4.0 |
| Macedonia TFYR | 0.99 | 0.66 | 1.50 |
| Madagascar | 0.61 | 1.59 | 0.38 |
| Malawi | 0.48 | 0.47 | 1.02 |
| Malaysia | 1.10 | 1.51 | 0.73 |
| Mali | 1.21 | 1.26 | 0.96 |
| Mauritania | 1.72 | 3.94 | 0.44 |
| Mexico | 0.97 | 0.69 | 1.40 |
| Moldova | 0.79 | 1.06 | 0.75 |
| Mongolia | 5.53 | 7.87 | 0.70 |
| Montenegro | 1.10 | 0.43 | 2.6 |
| Morocco | 0.90 | 0.48 | 1.9 |
| Mozambique | 0.36 | 1.23 | 0.29 |
| Myanmar | 0.96 | 1.26 | 0.76 |
| Namibia | 1.26 | 6.02 | 0.21 |
| Nepal | 0.49 | 0.40 | 1.21 |
| Netherlands | 1.15 | 0.67 | 1.7 |
| Nicaragua | 0.77 | 1.45 | 0.53 |
| Niger | 1.30 | 1.28 | 1.02 |
| Nigeria | 0.69 | 0.62 | 1.12 |
| Norway | 1.79 | 3.81 | 0.47 |
| Oman | 1.76 | 1.31 | 1.34 |
| Pakistan | 0.27 | 0.32 | 0.85 |
| Panama | 0.95 | 1.13 | 0.84 |
| Papua New Guinea | 0.80 | 1.09 | 0.73 |
| Paraguay | 1.41 | 4.74 | 0.30 |
| Peru | 1.19 | 1.00 | 1.19 |
| Philippines | 0.69 | 0.40 | 1.8 |
| Poland | 0.93 | 1.15 | 0.81 |
| Portugal | 1.30 | 0.39 | 3.3 |
| Qatar | 1.67 | 0.96 | 1.7 |
| Romania | 0.93 | 1.42 | 0.65 |
| Russian Federation | 1.20 | 2.62 | 0.46 |
| Rwanda | 0.42 | 0.39 | 1.09 |
| Saint Lucia | 0.79 | 0.23 | 3.4 |
| Saudi Arabia | 1.23 | 0.33 | 3.8 |
| Senegal | 0.68 | 0.54 | 1.26 |
| Serbia | 0.84 | 1.17 | 0.72 |
| Sierra Leone | 0.72 | 0.91 | 0.79 |
| Singapore | 0.96 | 0.01 | 70 |
| Slovakia | 0.96 | 1.04 | 0.92 |
| Slovenia | 0.95 | 0.38 | 2.5 |
| Solomon Islands | 1.33 | 1.76 | 0.75 |
| Somalia | 0.49 | 0.68 | 0.72 |
| South Africa | 0.75 | 0.91 | 0.82 |
| South Sudan | 1.10 | 1.20 | 0.92 |
| Spain | 1.25 | 1.00 | 1.25 |
| Sri Lanka | 0.67 | 0.40 | 1.69 |
| Sudan | 0.79 | 0.81 | 0.98 |
| Suriname | 1.00 | 7.59 | 0.13 |
| Sweden | 1.32 | 3.07 | 0.43 |
| Switzerland | 0.70 | 0.25 | 2.8 |
| Syrian Arab Republic | 0.60 | 0.54 | 1.12 |
| Tajikistan | 0.55 | 0.42 | 1.30 |
| Tanzania, United Republic of | 0.84 | 0.82 | 1.03 |
| Thailand | 0.75 | 0.92 | 0.81 |
| Timor-Leste | 0.28 | 1.06 | 0.26 |
| Togo | 0.59 | 0.46 | 1.28 |
| Trinidad and Tobago | 1.27 | 1.41 | 0.90 |
| Tunisia | 0.83 | 0.64 | 1.29 |
| Turkey | 0.97 | 0.84 | 1.16 |
| Turkmenistan | 1.69 | 2.41 | 0.70 |
| Uganda | 0.49 | 0.44 | 1.11 |
| Ukraine | 1.31 | 2.32 | 0.56 |
| United Arab Emirates | 1.61 | 0.50 | 3.2 |
| United Kingdom | 0.77 | 0.84 | 0.92 |
| United States of America | 1.31 | 2.03 | 0.65 |
| Uzbekistan | 0.81 | 0.71 | 1.13 |
| Venezuela, Bolivarian Republic of | 0.97 | 0.87 | 1.11 |
| Viet Nam | 1.05 | 0.75 | 1.39 |
| Yemen | 0.39 | 0.35 | 1.13 |
| Zambia | 0.56 | 1.02 | 0.54 |
| Zimbabwe | 0.51 | 0.39 | 1.30 |
Reference: This data was produced with Global Footprint Network’s National Footprint and Biocapacity Accounts. More data available at data.footprintnetwork.org.