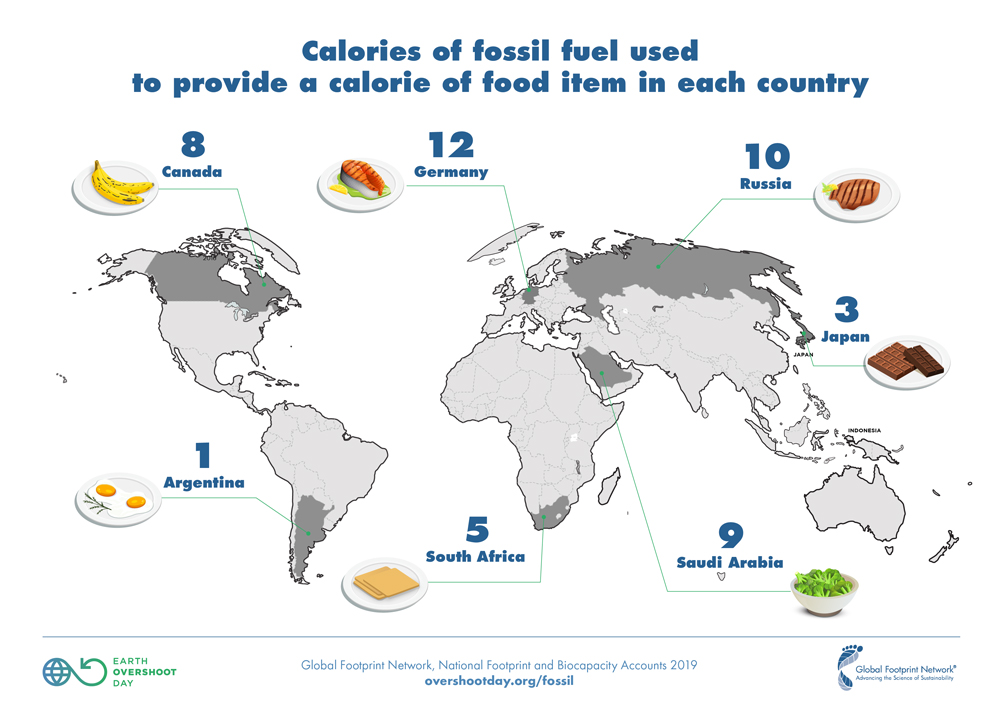
The fossil fuels required to grow, harvest, process, and distribute food makes up a significant part of the food Footprint. Although it wasn’t always the case, today we are firmly in the age of fossil fuel. The fossil fuels used to grow our food are invisible when we are enjoying our meals, which is why we use infographics to reveal how much fuel it takes to provide the food on our plates. They depict how many calories of fossil fuel are used, from farm to store, for every calorie of food we consume. This does not include the additional energy required to transport the food from the store nor to power your lights, stove, refrigerator, or dishwasher at home.
Prevalence of fossil fuels in the global food system
Fossil fuels are everywhere, and they are one of the main reasons that humanity is in ecological overshoot. In industrial agriculture, crops are dependent on large amounts of nitrogen fertilizers, petroleum-based agricultural chemicals, pumps that run irrigation, diesel for machinery, and oil for food distribution across the world. The green revolution focused on creating exponentially higher crop yields with decreased dependency on human labor, but it also boosted our food system’s dependence on fossil fuels.
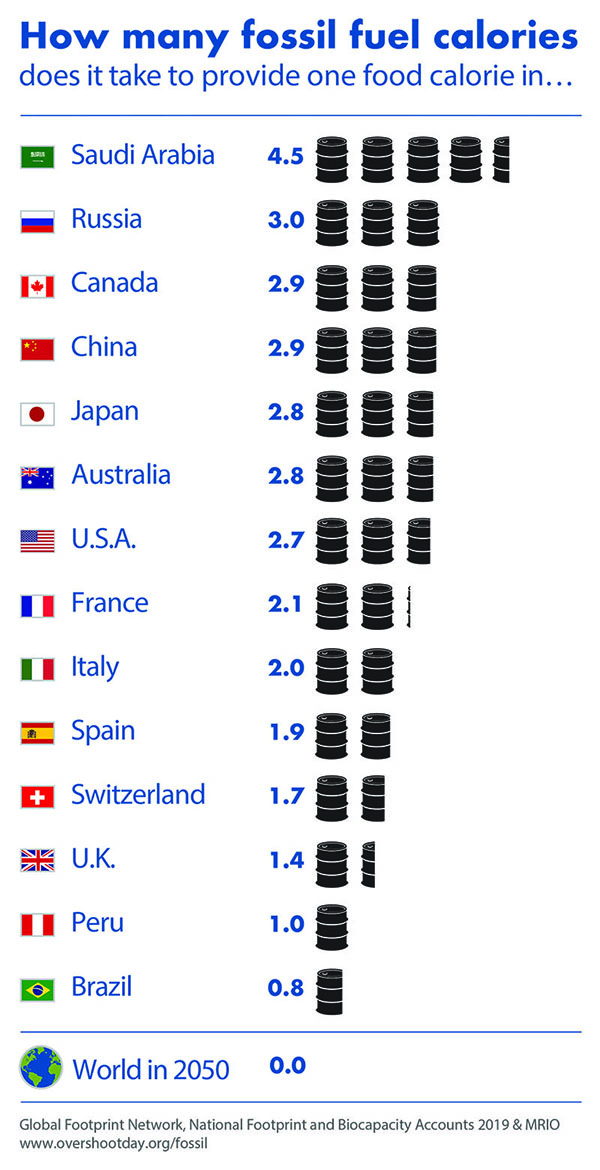
While our food system can provide more food, it is now more dependent than ever on finite resources and inexpensive fossil fuel energy. It is no wonder that, in many cases, our food is embedded with more “fossil fuel calories” than nutritional calories. For example, in Slovenia it takes 7 calories of fossil fuel to provide every 1 calorie of meat consumed. The number of calories of fossil fuel required varies by food group and among countries as shown in the table below (1).
Food is a powerful means to #MoveTheDate
Living up to the Paris Climate Agreement requires that we move away from fossil fuels. That means not only adopting renewables and electrifying transport, but also revolutionizing the way we feed ourselves. By 2050, our food should require zero calories of fossil fuel for every calorie of food we eat. David Biederman observes correctly: “In a society where most people are detached from food production, it is easy to forget how much of our ability to enjoy abundant food depends on extraordinary amounts of affordable energy.” Besides climate change, food production also contributes heavily to the degradation of soils, water quality, and biodiversity. So, what does moving away from fossil fuel-dependent agriculture mean for us?
It starts with recognizing that we cannot take our current situation for granted. Our current food and resource security is heavily subsidized by cheap and versatile fossil fuel, which has a “shelf life” that is about to expire.
We can take our future into our own hands. With our forks. We can choose what food we’ll eat and the types of agriculture we’ll support. Together we can opt for a future where those who feed us are fairly compensated for their work, including the work of protecting and maintaining nature’s regenerative power.
ENDNOTE
(1) Our infographics show food items and oil in a glass. The fossil fuel calculation includes the entire supply chain from production on the farm to the point of purchase by the final consumer. It does not include additional energy requirements by household consumers for transportation, refrigeration, or cooking food after the point of purchase. These illustrations are all drawn to scale. The fossil fuel intensities are calculated by Global Footprint Network using Ecological Footprint based environmentally-extended Multi-Regional Input-Output assessments (EF-MRIO).
Click table header to sort
| Country | Bread and Cereals | Meat | Fish and Seafood | Milk, Cheese, and Eggs | Oils and Fats |
Fruit | Vegetables | Confectionary, Sugar, Jam, Honey, and Chocolate | Alcoholic Beverages | Totals |
|---|---|---|---|---|---|---|---|---|---|---|
| Algeria | 0.2 | 5.9 | 34.4 | 2.2 | 3.5 | 1.9 | 1.3 | 0.9 | 20.5 | 1.5 |
| Angola | 0.2 | 1.9 | 2.0 | 5.5 | 0.7 | 0.8 | 0.1 | 1.2 | 3.4 | 0.8 |
| Argentina | 0.4 | 1.5 | 18.3 | 1.1 | 1.1 | 3.5 | 2.1 | 0.6 | 3.0 | 1.3 |
| Australia | 1.0 | 1.4 | 21.9 | 1.7 | 0.9 | 7.5 | 5.1 | 2.9 | 6.6 | 2.8 |
| Austria | 0.6 | 3.3 | 14.6 | 1.3 | 0.5 | 6.0 | 3.2 | 1.1 | 3.8 | 1.9 |
| Bangladesh | 0.4 | 7.3 | 10.1 | 3.0 | 1.4 | 5.0 | 0.9 | 1.9 | - | 1.0 |
| Belarus | 0.4 | 8.4 | 23.1 | 19.0 | 6.8 | 15.3 | 3.3 | 0.6 | 1.2 | 5.1 |
| Belgium | 1.0 | 5.2 | 22.0 | 1.7 | 1.1 | 9.1 | 4.0 | 2.0 | 6.0 | 3.0 |
| Benin | 1.2 | 2.4 | 2.2 | 0.4 | 0.9 | 1.7 | 0.1 | 0.9 | 0.7 | 0.8 |
| Bolivia | 0.5 | 3.5 | 28.8 | 1.6 | 4.1 | 3.1 | 1.4 | 1.6 | 6.0 | 1.9 |
| Brazil | 0.3 | 1.1 | 9.3 | 0.7 | 0.4 | 1.8 | 0.7 | 0.5 | 1.1 | 0.8 |
| Bulgaria | 0.4 | 6.5 | 16.0 | 1.7 | 1.2 | 3.6 | 2.8 | 1.6 | 2.2 | 2.1 |
| Cameroon | 0.1 | 2.6 | 2.2 | 1.3 | 0.2 | 0.8 | 0.2 | 0.6 | 0.9 | 0.4 |
| Canada | 1.0 | 5.0 | 16.4 | 3.8 | 1.0 | 7.6 | 3.5 | 2.1 | 7.4 | 2.9 |
| Chile | 0.3 | 2.2 | 17.1 | 1.8 | 2.0 | 4.6 | 1.6 | 0.8 | 2.2 | 1.7 |
| China | 0.8 | 3.5 | 15.9 | 4.1 | 2.0 | 10.8 | 2.6 | 8.0 | 4.0 | 2.9 |
| Colombia | 0.4 | 2.6 | 9.1 | 1.2 | 0.8 | 0.9 | 1.0 | 0.3 | 1.5 | 1.0 |
| Congo | 0.3 | 1.6 | 2.7 | 3.8 | 0.7 | 1.1 | 0.1 | 0.7 | 1.3 | 0.6 |
| Costa Rica | 0.7 | 4.4 | 8.0 | 0.6 | 0.7 | 2.4 | 1.8 | 1.0 | 2.4 | 1.6 |
| Côte d'Ivoire | 0.3 | 2.7 | 1.6 | 1.5 | 1.3 | 1.6 | 0.2 | 0.5 | 4.1 | 0.7 |
| Croatia | 0.6 | 7.0 | 14.9 | 2.6 | 3.6 | 6.5 | 2.8 | 1.0 | 4.3 | 3.0 |
| Cuba | 0.3 | 2.0 | 13.6 | 1.3 | 1.1 | 1.2 | 0.5 | 0.5 | 3.0 | 0.9 |
| Czech Republic | 0.8 | 4.2 | 17.1 | 1.2 | 0.7 | 5.2 | 1.9 | 1.5 | 2.7 | 1.9 |
| Denmark | 0.6 | 3.2 | 5.4 | 1.0 | 0.9 | 5.2 | 3.0 | 0.8 | 4.8 | 2.0 |
| El Salvador | 0.5 | 2.4 | 7.3 | 0.9 | 1.8 | 2.8 | 0.9 | 0.9 | 2.5 | 1.1 |
| Estonia | 0.6 | 3.0 | 24.1 | 2.4 | 3.3 | 6.7 | 2.4 | 2.2 | 3.7 | 2.6 |
| Ethiopia | 0.2 | 1.5 | 56.1 | 0.7 | 0.1 | 6.2 | 0.2 | 0.6 | 0.9 | 0.3 |
| Finland | 0.6 | 3.8 | 8.2 | 1.3 | 1.9 | 6.5 | 3.8 | 2.1 | 7.0 | 2.7 |
| France | 0.5 | 3.2 | 8.5 | 1.1 | 0.9 | 5.9 | 3.6 | 1.5 | 4.7 | 2.1 |
| Gabon | 0.5 | 2.7 | 5.6 | 3.1 | 1.7 | 0.9 | 0.5 | 1.8 | 2.2 | 1.4 |
| Georgia | 0.4 | 10.7 | 14.3 | 4.2 | 2.4 | 12.4 | 4.9 | 0.8 | 6.6 | 2.4 |
| Germany | 0.6 | 2.2 | 11.6 | 0.7 | 0.3 | 5.3 | 3.2 | 1.0 | 2.3 | 1.6 |
| Ghana | 0.8 | 3.6 | 3.8 | 2.8 | 0.6 | 1.4 | 0.4 | 0.8 | 5.9 | 0.9 |
| Greece | 0.6 | 3.0 | 16.7 | 1.1 | 1.3 | 4.4 | 2.4 | 1.8 | 3.7 | 1.9 |
| Guatemala | 0.5 | 3.6 | 44.8 | 1.0 | 0.9 | 5.1 | 1.9 | 0.6 | 4.5 | 1.2 |
| Haiti | 0.1 | 0.9 | 2.5 | 0.8 | 0.2 | 0.3 | 0.1 | 0.3 | 0.3 | 0.2 |
| Hungary | 0.6 | 3.9 | 15.3 | 1.5 | 0.9 | 4.3 | 1.7 | 1.0 | 4.4 | 1.9 |
| India | 0.5 | 3.5 | 12.6 | 1.5 | 1.2 | 3.5 | 1.0 | 0.8 | 6.6 | 1.0 |
| Indonesia | 0.2 | 2.7 | 4.0 | 2.3 | 0.7 | 1.9 | 0.8 | 0.8 | 81.9 | 0.7 |
| Israel | 0.5 | 3.4 | 11.1 | 1.5 | 1.2 | 5.1 | 3.7 | 2.2 | 13.3 | 2.3 |
| Italy | 0.5 | 5.7 | 10.6 | 1.8 | 1.1 | 3.2 | 2.3 | 1.2 | 3.5 | 2.0 |
| Jamaica | 0.4 | 2.0 | 6.1 | 1.3 | 0.8 | 1.9 | 1.0 | 0.4 | 2.8 | 1.2 |
| Japan | 0.9 | 2.9 | 5.9 | 2.1 | 0.7 | 18.8 | 6.4 | 2.7 | 2.2 | 2.8 |
| Kenya | 0.4 | 1.5 | 9.3 | 0.8 | 2.6 | 3.4 | 0.8 | 0.3 | 3.5 | 0.9 |
| Korea, Republic of | 0.8 | 4.7 | 7.8 | 6.6 | 1.0 | 16.4 | 5.6 | 1.9 | 2.2 | 2.9 |
| Kuwait | 1.0 | 4.5 | 41.1 | 2.2 | 2.0 | 6.7 | 5.5 | 2.2 | - | 4.6 |
| Latvia | 0.6 | 3.9 | 8.9 | 1.2 | 4.1 | 8.9 | 2.0 | 2.8 | 6.8 | 2.9 |
| Lebanon | 0.9 | 3.9 | 19.2 | 4.3 | 1.9 | 4.3 | 2.3 | 0.6 | 28.8 | 2.4 |
| Lithuania | 0.8 | 4.7 | 9.3 | 3.1 | 5.8 | 11.5 | 3.5 | 2.1 | 5.3 | 3.5 |
| Luxembourg | 1.5 | 4.5 | 23.0 | 4.5 | 4.0 | 8.2 | 6.5 | 4.0 | 7.0 | 5.2 |
| Malaysia | 0.7 | 2.2 | 11.3 | 3.1 | 1.6 | 11.4 | 4.9 | 1.5 | 37.6 | 2.6 |
| Mexico | 0.3 | 2.7 | 16.0 | 2.1 | 1.3 | 4.2 | 2.5 | 1.1 | 4.2 | 1.7 |
| Morocco | 0.5 | 2.5 | 6.7 | 1.0 | 0.9 | 2.8 | 1.8 | 1.3 | 6.7 | 1.0 |
| Mozambique | 0.3 | 0.9 | 5.8 | 0.7 | 0.5 | 3.0 | 0.1 | 1.3 | 3.7 | 0.5 |
| Myanmar | 0.2 | 0.5 | 1.3 | 0.5 | 0.2 | 1.1 | 0.3 | 0.3 | 6.4 | 0.4 |
| Namibia | 0.4 | 3.0 | 4.9 | 6.0 | 3.7 | 4.8 | 0.8 | 1.0 | 1.5 | 2.6 |
| Nepal | 0.1 | 0.3 | 11.7 | 1.4 | 0.3 | 0.8 | 0.2 | 0.3 | 2.3 | 0.3 |
| Netherlands | 0.6 | 3.2 | 7.9 | 0.9 | 1.1 | 2.9 | 2.2 | 1.1 | 3.5 | 1.9 |
| Nicaragua | 0.3 | 3.0 | 9.6 | 0.8 | 1.3 | 3.6 | 1.2 | 0.6 | 6.5 | 1.0 |
| Niger | 0.1 | 0.8 | 7.4 | 0.2 | 0.1 | 1.0 | 0.1 | 0.5 | 23.5 | 0.2 |
| Nigeria | 0.2 | 4.6 | 2.4 | 0.5 | 0.2 | 2.1 | 0.2 | 0.2 | 0.5 | 0.4 |
| Norway | 0.4 | 1.5 | 3.7 | 2.2 | 2.2 | 4.3 | 2.6 | 1.4 | 4.6 | 1.9 |
| Oman | 1.0 | 8.8 | 6.5 | 3.5 | 5.4 | 1.6 | 4.0 | 1.0 | 178.6 | 4.7 |
| Pakistan | 0.1 | 0.6 | 13.7 | 0.3 | 0.5 | 1.5 | 0.3 | 0.2 | - | 0.4 |
| Panama | 0.3 | 4.8 | 5.6 | 0.6 | 0.5 | 2.6 | 0.8 | 1.0 | 1.0 | 1.2 |
| Paraguay | 0.1 | 3.6 | 7.3 | 0.7 | 0.4 | 1.6 | 0.2 | 0.3 | 3.4 | 0.9 |
| Peru | 0.3 | 3.4 | 5.1 | 1.2 | 2.1 | 0.8 | 0.3 | 0.8 | 1.3 | 1.0 |
| Philippines | 0.4 | 2.1 | 4.8 | 2.8 | 0.8 | 0.9 | 1.0 | 0.5 | 3.0 | 0.9 |
| Poland | 0.4 | 3.5 | 5.5 | 3.2 | 0.9 | 4.7 | 1.5 | 0.8 | 2.1 | 1.6 |
| Portugal | 0.6 | 2.8 | 9.9 | 1.1 | 1.0 | 4.3 | 2.4 | 2.0 | 2.4 | 2.0 |
| Romania | 0.4 | 4.6 | 14.9 | 0.6 | 1.2 | 2.1 | 0.9 | 1.7 | 2.1 | 1.5 |
| Russian Federation | 0.4 | 9.6 | 6.7 | 5.3 | 1.7 | 7.5 | 1.9 | 1.7 | 5.1 | 3.0 |
| Saudi Arabia | 1.6 | 7.9 | 29.2 | 3.1 | 1.5 | 5.7 | 9.0 | 2.4 | - | 4.5 |
| Senegal | 0.3 | 4.0 | 5.7 | 1.7 | 0.4 | 4.8 | 0.7 | 0.9 | 19.4 | 0.7 |
| Serbia | 0.3 | 2.0 | 21.6 | 1.1 | 1.8 | 2.0 | 1.5 | 1.0 | 1.7 | 1.3 |
| Slovakia | 0.9 | 5.4 | 18.7 | 2.6 | 1.0 | 7.4 | 3.0 | 2.3 | 3.3 | 2.4 |
| Slovenia | 0.4 | 6.9 | 15.7 | 2.5 | 1.8 | 4.0 | 3.4 | 2.6 | 3.5 | 2.5 |
| South Africa | 0.4 | 5.4 | 26.3 | 5.2 | 1.5 | 17.6 | 4.2 | 2.0 | 3.0 | 2.4 |
| Spain | 0.7 | 2.5 | 12.9 | 0.9 | 0.7 | 5.1 | 2.5 | 1.6 | 1.4 | 1.9 |
| Sri Lanka | 0.4 | 0.9 | 2.5 | 0.7 | 0.7 | 2.3 | 0.8 | 0.6 | 5.8 | 0.7 |
| Sudan | 0.1 | 1.0 | 33.1 | 0.2 | 0.5 | 0.5 | 0.3 | 0.2 | - | 0.4 |
| Sweden | 0.7 | 4.4 | 7.5 | 1.0 | 0.8 | 6.5 | 3.6 | 1.4 | 4.6 | 2.3 |
| Switzerland | 0.4 | 2.1 | 11.0 | 1.4 | 1.1 | 3.9 | 3.1 | 0.6 | 3.4 | 1.7 |
| Tanzania, United Republic of | 0.2 | 1.9 | 4.1 | 0.6 | 0.2 | 0.6 | 0.1 | 0.5 | 0.9 | 0.3 |
| Togo | 0.3 | 2.2 | 6.3 | 1.5 | 1.4 | 7.6 | 0.1 | 0.6 | 3.5 | 0.6 |
| Tunisia | 0.2 | 3.5 | 13.6 | 2.3 | 2.2 | 4.0 | 1.7 | 0.8 | 6.8 | 1.4 |
| Turkey | 0.3 | 4.9 | 29.9 | 2.4 | 1.3 | 3.9 | 1.6 | 1.0 | 16.4 | 1.7 |
| Ukraine | 0.2 | 5.0 | 5.8 | 2.8 | 3.1 | 8.8 | 1.5 | 0.5 | 4.9 | 1.9 |
| United Arab Emirates | 0.8 | 5.3 | 19.3 | 1.7 | 2.2 | 6.7 | 3.9 | 3.0 | - | 4.5 |
| United Kingdom | 0.4 | 1.5 | 9.9 | 0.7 | 0.3 | 4.0 | 2.0 | 1.0 | 4.1 | 1.4 |
| United States of America | 0.8 | 4.2 | 17.4 | 1.5 | 0.6 | 6.9 | 4.1 | 1.2 | 4.9 | 2.7 |
| Uzbekistan | 0.3 | 6.0 | 40.5 | 2.4 | 1.8 | 5.8 | 2.6 | 0.9 | 7.4 | 2.3 |
| Viet Nam | 0.8 | 1.7 | 11.8 | 10.9 | 1.6 | 2.1 | 1.1 | 2.3 | 16.5 | 2.0 |
| Zambia | 0.3 | 3.5 | 18.1 | 2.2 | 0.5 | 19.9 | 1.0 | 2.3 | 1.1 | 1.0 |
| Zimbabwe | 0.3 | 2.2 | 11.2 | 3.3 | 0.7 | 6.4 | 1.2 | 0.7 | 2.1 | 0.8 |
Reference: This data was produced with Global Footprint Network’s MRIO analysis which does not cover all countries. Countries with obvious data gaps were omitted. Calories of food are based on the specific basket of food consumed in each country as reported by the food balance sheets (FAOstat).